Quick Start
What is respond.io?
Setting Up an Account
Connecting Channels
Inviting Your Teammates
Getting Contacts to Message You
Automated Welcome and Away Messages
Responding to Messages
Glossary of Terms
Channels
WhatsApp Business Platform (API) Quick Start
Getting Ready for Inbound Conversations
Getting Ready for Promotional Messaging
WhatsApp Official Business Account (Blue Tick)
Grow your WhatsApp Audience by Maximizing Entry Points
Get WhatsApp API Account for Government Agencies
WhatsApp Business Calling API
Meta Business Verification
WhatsApp Message Templates
WhatsApp Pricing
WhatsApp Business Platform (API) Channel Configuration
WhatsApp Messaging Limits
Meta Product Catalog
Change Your WhatsApp Business Display Name
Migrating from WhatsApp Personal or WhatsApp Business App
Phone Number Migration to respond.io WhatsApp Business Platform (API)
Turn-off WhatsApp Number Two-Step Verification
WhatsApp Cloud API
360dialog WhatsApp
Twilio WhatsApp
MessageBird WhatsApp
Vonage WhatsApp
Phone Number Migration to WhatsApp Cloud API
TikTok
Facebook Messenger
Facebook Messenger Overview
Facebook Messenger Quick Start
Facebook Chat Plugin
Facebook Private Replies
Facebook Message Tag
LINE
Viber
Telegram
Website Chat Widget
Website Chat Widget Overview
Website Chat Widget Quick Start
Install Website Chat Widget on WordPress
Install Website Chat Widget on Shopify
Install Website Chat Widget on Wix
Install Website Chat Widget on Joomla
Install Website Chat Widget on Squarespace
SMS
Custom Channel
Product
Dashboard & Reporting
Dashboard
Reports Overview
Reports: Conversations
Reports: Responses
Reports: Resolutions
Reports: Messages
Reports: Contacts
Reports: Assignments
Reports: Leaderboard
Reports: Users
Reports: Broadcasts
Inbox
Inbox Overview
Assignment and Closing a Conversation
Custom Inboxes
Interacting with Respond AI Prompts
Using AI Assist
Contacts
Broadcasts Module
Workflows
Workflows Overview
Workflow Triggers
Workflow Steps Overview
Step: AI Agent
Step: Send a Message
Step: Ask a Question
Step: Assign To
Step: Branch
Step: Update Contact Tag
Step: Update Contact Field
Step: Open Conversation
Step: Close Conversation
Step: Add Comment
Step: Jump To
Step: Date & Time
Step: Wait
Step: Trigger Another Workflow
Step: HTTP Request
Step: Add Google Sheets Row
Step: Send TikTok Lower Funnel Event
How to Avoid Workflow Loops
Step: Update Lifecycle
Step: Send Conversions API Event
Dynamic Variables
Workspace Settings
Managing a Workspace
General info (previously General)
User settings (previously Users)
Teams (previously Team Settings)
Channels
Growth Widgets
Contact Fields
Integrations
Respond AI
Closing Notes
Snippets
Tags
Files
Data Export
Contact Import
Lifecycle
Organization Settings
Organization Overview
Account info (previously General)
Admin Settings (previously Users)
Workspaces
WhatsApp Fees
Billing & Usage
Security
User Account
Mobile App
Installing respond.io Mobile App
Messaging From Your Mobile
Managing Notifications On Your Mobile
Configuring mobile app settings
Help Menu
Conversation Led Growth
Capture Leads
How to Collect Contacts’ Emails and Phone Numbers
How to Route Contacts from CTC Ads to Agents
How to Send Outbound Sales Messages
How to Track Conversation Source from Multiple Websites
How to Enrich Customer Data from a CRM or other Business Software
Convert Leads
How to Automate Product Info Sharing in Conversations Initiated via CTC Ads
How to Automatically Qualify Contacts Based on Budget Using AI Agent
Assignment Strategy: How to Automate Contact Distribution & Load Balancing
How to Maximize Customer Service Potential with AI Agent
How to Automate Contact Information Collection with AI
How to Block Contacts and Manage Spam
How to Create Automated Welcome and Away Messages
How to Create Automated Chat Menus
How to Route Contacts to Preferred AI Agent
How to Route Contacts by their Preferred Language
How to Route Contacts by Team Functions
How to Route Contacts by Shifts
Assignment Strategy: How to Unassign Agents after Conversations Closed
How to Get Contacts’ Consent for Personal Data Collection
How to Promptly Transfer Conversation Between Agents
How to Guide Customers from Exploration to Purchase with Engaging Menus
How to Optimize Customer Onboarding with Automated & Customized Welcome Messages
How to Streamline Meeting Scheduling via CTC Ads
How to Get a Complete View of the Customers
How to Simplify Customer Escalation with Automation
How to Transfer Contacts to the Next Shift Automatically
How to Optimize Agents’ Productivity in the Inbox Module
How to Write an Optimal AI Persona (Best Practices)
How to Write the Best Knowledge Sources for AI Agents
How to Align AI Conversations with Your Brand Voice
How to Draft Customer Replies with AI
How to Convert Image to Text Using AI
How to Automate Calculations Using AI
How to Automate Lifecycle Tracking in Google Sheets
Retain Customers
How to Route New and Returning Contacts
How to Route VIP Contacts
How to Send CSAT to Customer and Save Data in Google Sheets or CRMs
How to Send Outbound Support Messages
How to improve lead targeting and automatically send purchase events to Meta when a customer makes a payment
Reporting and Analytics
Broadcasts Use Cases
How to Send a Simple Broadcast
How to Start a Workflow Based on Broadcast Response
How to Import to Broadcast via WhatsApp
How to Troubleshoot a Failed Broadcast
Integrations
Dialogflow
Dialogflow Overview
Dialogflow: Connecting to Dialogflow
Dialogflow: Creating a Chatbot
Dialogflow: Managing Intents
Dialogflow: Parameters
Dialogflow: Events
Dialogflow: Response Templates
Dialogflow: Custom Payloads
Dialogflow: Fulfillment Webhook Request
Zapier
E-Commerce Integration: Shopify
E-Commerce Integration: BigCommerce
E-Commerce Integration: WooCommerce
E-Commerce Integration: Magento
CRM Integration: HubSpot
CRM Integration: Salesforce
CRM Integration: Pipedrive
CRM Integration: ActiveCampaign
Zapier
Make
Meta Business Accounts
TikTok Messaging Ads Integration
Developer API
HubSpot
Webhooks
Salesforce
Table of Contents
- Home
- Product
- Dashboard & Reporting
- Reports Overview
Reports Overview
 Updated
by Susan Swier
Updated
by Susan Swier
This module provides more insights into your workforce's performance on the platform and helps businesses to make informed decisions based on information gathered through the platform.
Data shown in the reports are according to the Workspace’s Timezone settings so ensure that you have set your preferred timezone.
Getting Here
This module can be accessed from the side navigation menu under the menu item, Reports.
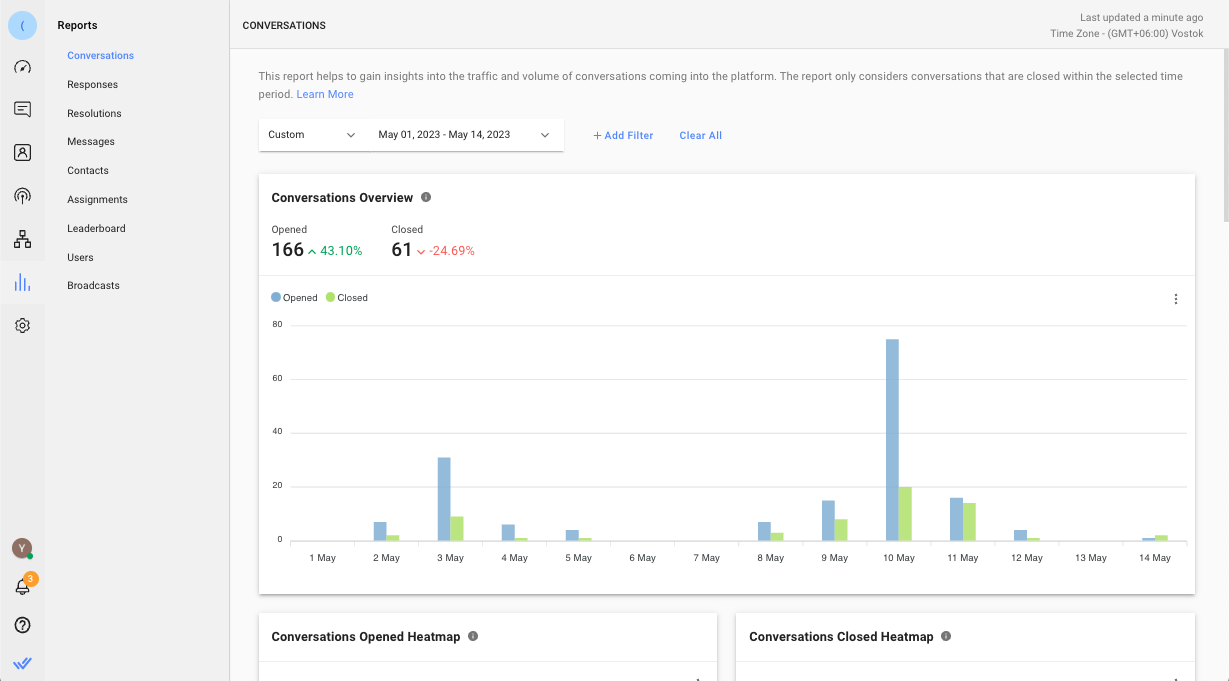
Report Tabs
In this module, there are 9 reporting tabs. Each tab consists of metrics, charts and listings related to the entity. The tabs are as follows:
Report Filters
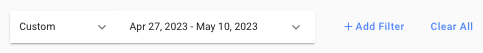
Each tab has its own set of report filters that enable you to perform in-depth analysis or create insightful information from the reports.
Some filters are only applicable to certain overviews in the report tabs. In this case, those overviews will be empty and indicated as not applicable.
The filters applied are retained on the user level and not affected by changes made by other users so that you can pick up from where you left off.
Report Features
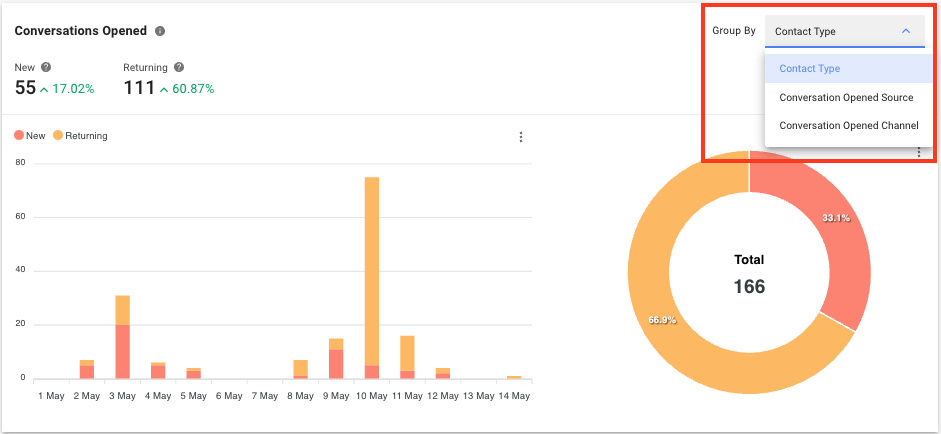
Group By
For charts that contain multiple breakdown options, you can click the Group By drop-down list to view the options available.
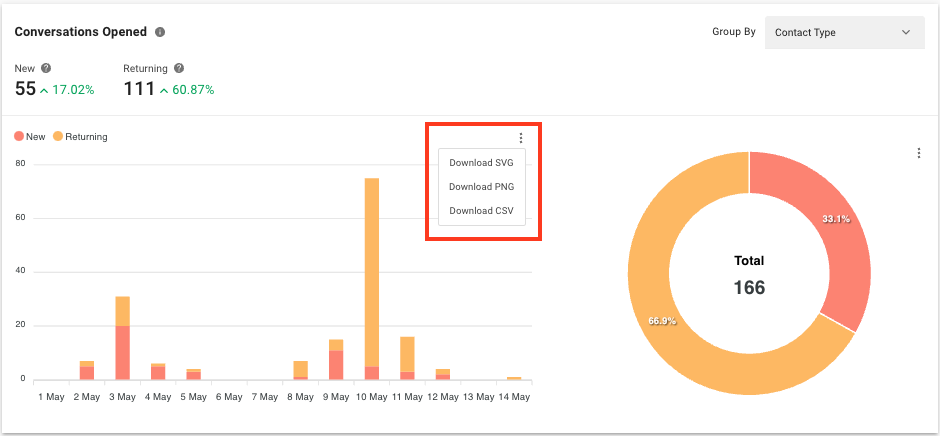
Download Charts
Click the 3 dots icon next to the chart to download the selected chart. There are 3 options available: SVG, PNG and CSV.
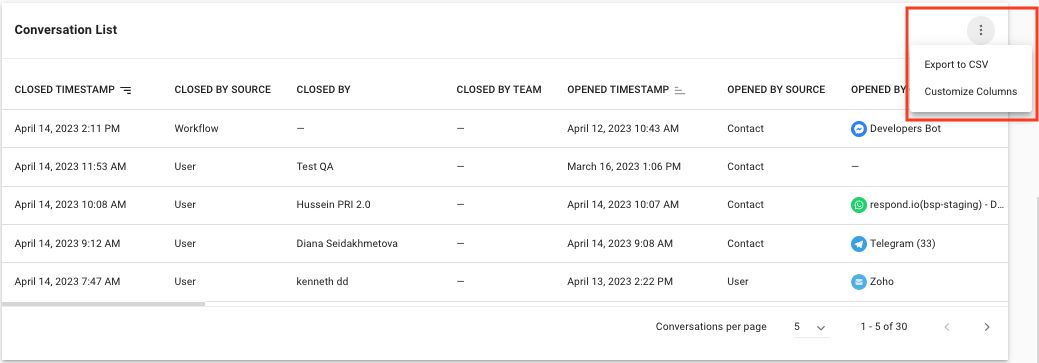
Export Data to CSV and Customize Columns
Click the 3 dots icon next to a list of data to export the list to a CSV file. You may also choose to display or hide columns to view only details that are relevant to you. Your selections will not affect the viewing of other users.
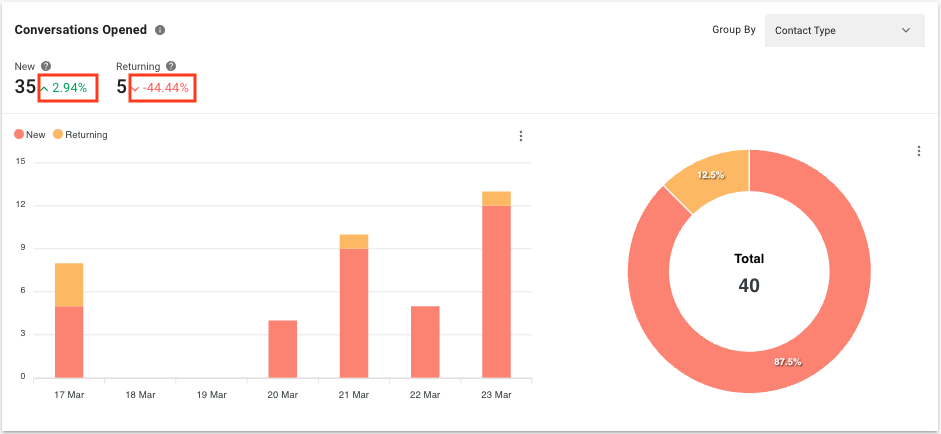
Percentage of Difference
On the right side of the metrics shown in some of the charts, you can see a percentage of difference. The value is compared to the same period prior to the selected period. If the selected period is the last 7 days (e.g. 17 Mar - 23 Mar), the percentage of difference is compared to the 7 days prior to the last 7 days (e.g. 10 Mar - 16 Mar).
FAQ and Troubleshooting
Can I view historical data in the Reports module after a plan change?
Yes, you can view historical data from one year ago, starting from the change date to the relevant plan.
Why is the timestamp shown differently when downloading a CSV file from the Reports module?
The timestamp is shown in milliseconds. You can convert the timestamp to minutes using the following formula:
milliseconds / 1000 / 60 = minutes
For example, if the timestamp is 900000 milliseconds, to convert it to minutes, you would calculate:
900000 / 1000 / 60 = 15 minutes
Feeling stuck? Do not fear.
Need assistance? Contact us for support. Help is here!This is the text block that will appear when the button is clicked.
Dashboard
Reports: Conversations
Related Articles
Reports: Leaderboard
Instantly identify and analyze top performing users and teams in the Workspace.
Reports: Broadcasts
View the delivery rates of broadcasts to gain insights into the performance and delivery data of the broadcasts.
Reports: Assignments
View the Contact assignment activity on the platform.