Quick Start
What is respond.io?
Setting Up an Account
Connecting Channels
Inviting Your Teammates
Getting Contacts to Message You
Automated Welcome and Away Messages
Responding to Messages
Glossary of Terms
Channels
WhatsApp Business Platform (API) Quick Start
Getting Ready for Inbound Conversations
Getting Ready for Promotional Messaging
WhatsApp Official Business Account (Blue Tick)
Grow your WhatsApp Audience by Maximizing Entry Points
Get WhatsApp API Account for Government Agencies
WhatsApp Business Calling API
Meta Business Verification
WhatsApp Message Templates
WhatsApp Pricing
WhatsApp Business Platform (API) Channel Configuration
WhatsApp Messaging Limits
Meta Product Catalog
Change Your WhatsApp Business Display Name
Migrating from WhatsApp Personal or WhatsApp Business App
Phone Number Migration to respond.io WhatsApp Business Platform (API)
Turn-off WhatsApp Number Two-Step Verification
WhatsApp Cloud API
360dialog WhatsApp
Twilio WhatsApp
MessageBird WhatsApp
Vonage WhatsApp
Phone Number Migration to WhatsApp Cloud API
TikTok
Facebook Messenger
Facebook Messenger Overview
Facebook Messenger Quick Start
Facebook Chat Plugin
Facebook Private Replies
Facebook Message Tag
LINE
Viber
Telegram
Website Chat Widget
Website Chat Widget Overview
Website Chat Widget Quick Start
Install Website Chat Widget on WordPress
Install Website Chat Widget on Shopify
Install Website Chat Widget on Wix
Install Website Chat Widget on Joomla
Install Website Chat Widget on Squarespace
SMS
Custom Channel
Product
Dashboard & Reporting
Dashboard
Reports Overview
Reports: Conversations
Reports: Responses
Reports: Resolutions
Reports: Messages
Reports: Contacts
Reports: Assignments
Reports: Leaderboard
Reports: Users
Reports: Broadcasts
Inbox
Inbox Overview
Assignment and Closing a Conversation
Custom Inboxes
Interacting with Respond AI Prompts
Using AI Assist
Contacts
Broadcasts Module
Workflows
Workflows Overview
Workflow Triggers
Workflow Steps Overview
Step: AI Agent
Step: Send a Message
Step: Ask a Question
Step: Assign To
Step: Branch
Step: Update Contact Tag
Step: Update Contact Field
Step: Open Conversation
Step: Close Conversation
Step: Add Comment
Step: Jump To
Step: Date & Time
Step: Wait
Step: Trigger Another Workflow
Step: HTTP Request
Step: Add Google Sheets Row
Step: Send TikTok Lower Funnel Event
How to Avoid Workflow Loops
Step: Update Lifecycle
Step: Send Conversions API Event
Dynamic Variables
Workspace Settings
Managing a Workspace
General info (previously General)
User settings (previously Users)
Teams (previously Team Settings)
Channels
Growth Widgets
Contact Fields
Integrations
Respond AI
Closing Notes
Snippets
Tags
Files
Data Export
Contact Import
Lifecycle
Organization Settings
Organization Overview
Account info (previously General)
Admin Settings (previously Users)
Workspaces
WhatsApp Fees
Billing & Usage
Security
User Account
Mobile App
Installing respond.io Mobile App
Messaging From Your Mobile
Managing Notifications On Your Mobile
Configuring mobile app settings
Help Menu
Conversation Led Growth
Capture Leads
How to Collect Contacts’ Emails and Phone Numbers
How to Route Contacts from CTC Ads to Agents
How to Send Outbound Sales Messages
How to Track Conversation Source from Multiple Websites
How to Enrich Customer Data from a CRM or other Business Software
Convert Leads
How to Automate Product Info Sharing in Conversations Initiated via CTC Ads
How to Automatically Qualify Contacts Based on Budget Using AI Agent
Assignment Strategy: How to Automate Contact Distribution & Load Balancing
How to Maximize Customer Service Potential with AI Agent
How to Automate Contact Information Collection with AI
How to Block Contacts and Manage Spam
How to Create Automated Welcome and Away Messages
How to Create Automated Chat Menus
How to Route Contacts to Preferred AI Agent
How to Route Contacts by their Preferred Language
How to Route Contacts by Team Functions
How to Route Contacts by Shifts
Assignment Strategy: How to Unassign Agents after Conversations Closed
How to Get Contacts’ Consent for Personal Data Collection
How to Promptly Transfer Conversation Between Agents
How to Guide Customers from Exploration to Purchase with Engaging Menus
How to Optimize Customer Onboarding with Automated & Customized Welcome Messages
How to Streamline Meeting Scheduling via CTC Ads
How to Get a Complete View of the Customers
How to Simplify Customer Escalation with Automation
How to Transfer Contacts to the Next Shift Automatically
How to Optimize Agents’ Productivity in the Inbox Module
How to Write an Optimal AI Persona (Best Practices)
How to Write the Best Knowledge Sources for AI Agents
How to Align AI Conversations with Your Brand Voice
How to Draft Customer Replies with AI
How to Convert Image to Text Using AI
How to Automate Calculations Using AI
How to Automate Lifecycle Tracking in Google Sheets
Retain Customers
How to Route New and Returning Contacts
How to Route VIP Contacts
How to Send CSAT to Customer and Save Data in Google Sheets or CRMs
How to Send Outbound Support Messages
How to improve lead targeting and automatically send purchase events to Meta when a customer makes a payment
Reporting and Analytics
Broadcasts Use Cases
How to Send a Simple Broadcast
How to Start a Workflow Based on Broadcast Response
How to Import to Broadcast via WhatsApp
How to Troubleshoot a Failed Broadcast
Integrations
Dialogflow
Dialogflow Overview
Dialogflow: Connecting to Dialogflow
Dialogflow: Creating a Chatbot
Dialogflow: Managing Intents
Dialogflow: Parameters
Dialogflow: Events
Dialogflow: Response Templates
Dialogflow: Custom Payloads
Dialogflow: Fulfillment Webhook Request
Zapier
E-Commerce Integration: Shopify
E-Commerce Integration: BigCommerce
E-Commerce Integration: WooCommerce
E-Commerce Integration: Magento
CRM Integration: HubSpot
CRM Integration: Salesforce
CRM Integration: Pipedrive
CRM Integration: ActiveCampaign
Zapier
Make
Meta Business Accounts
TikTok Messaging Ads Integration
Developer API
HubSpot
Webhooks
Salesforce
Table of Contents
- Home
- Product
- Dashboard & Reporting
- Reports: Leaderboard
Reports: Leaderboard
The Leaderboard report provides a visual representation of data that shows how users or teams are performing relative to each other on a specific metric. Managers can use these metrics to highlight exceptional performing agents or teams, or identify agents or teams that requires improvement.
Each metric ranks top performers at the top of the list and only the top 10 users or teams will be listed on the chart. Use filters to compare specific set of users or teams.
Getting Here
Navigate to the Reports module and click Leaderboard.
Filters
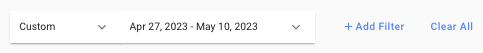
- Frequency and date — Select a date range from the drop-down list to be applied to the report. Alternatively, you can define the date range by frequency. The following options are available:
- Today
- Yesterday
- Last 7 Days
- Last 14 Days
- Last 30 Days
- This Month
- Last Month
- +Add Filter — You can refine the view of the report components by adding more filter(s). The following filters are available:
- User - Use this to view the performance of a specified user(s).
- Team - Use this to view the performance of a specified team(s).
- Clear All — You can use this option to reset the filters to the default selections.
- The selected filter(s) are not applicable here: This means the filter(s) you have selected are not applicable to the chart.
- The selected filter(s) have no applicable data: This means no data is available for the selected filter(s), for e.g. the chart is new and only available at a date later than the selected date range.
Report Components
Conversations Assigned (by User or Team)
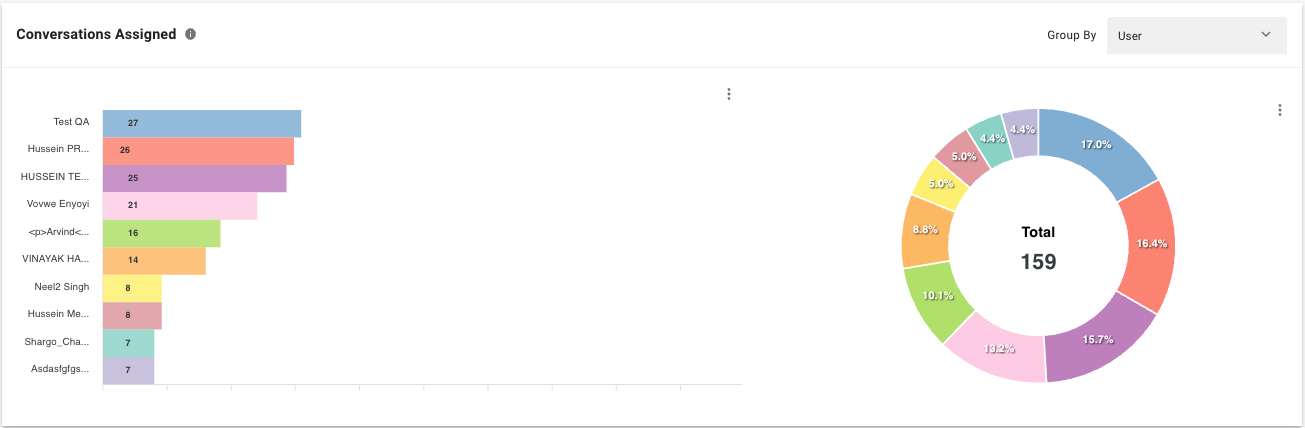
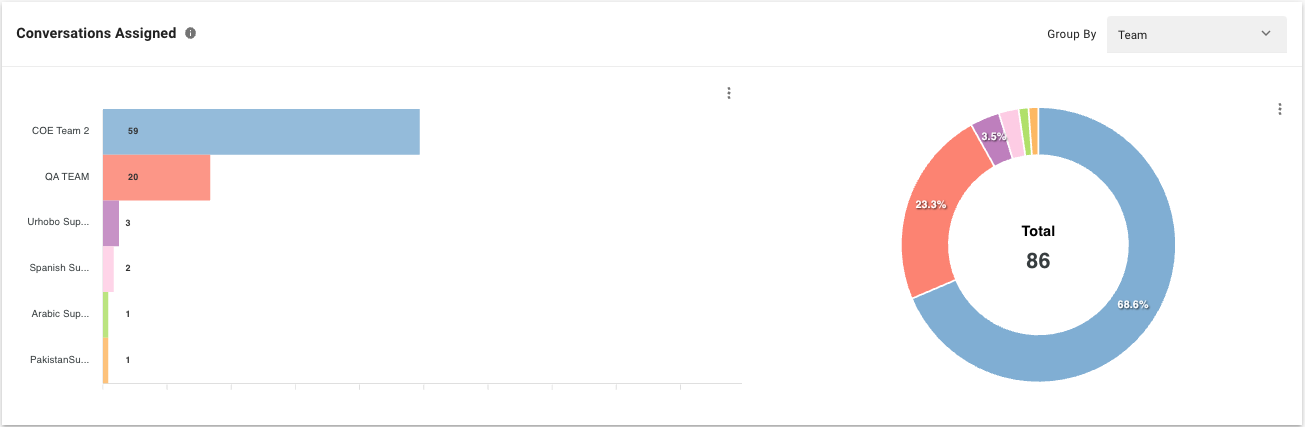
Metric
The users’ or teams’ number and percentage of conversations assigned within the selected period. The number of assignments is added every time a conversation is assigned to a user or team.
Bar Chart
Compares the users’ or teams’ number of conversations assigned within the selected period.
Pie Chart
The users’ or teams’ percentage and total number of conversations assigned within the selected period.
Conversations Closed by User or Team
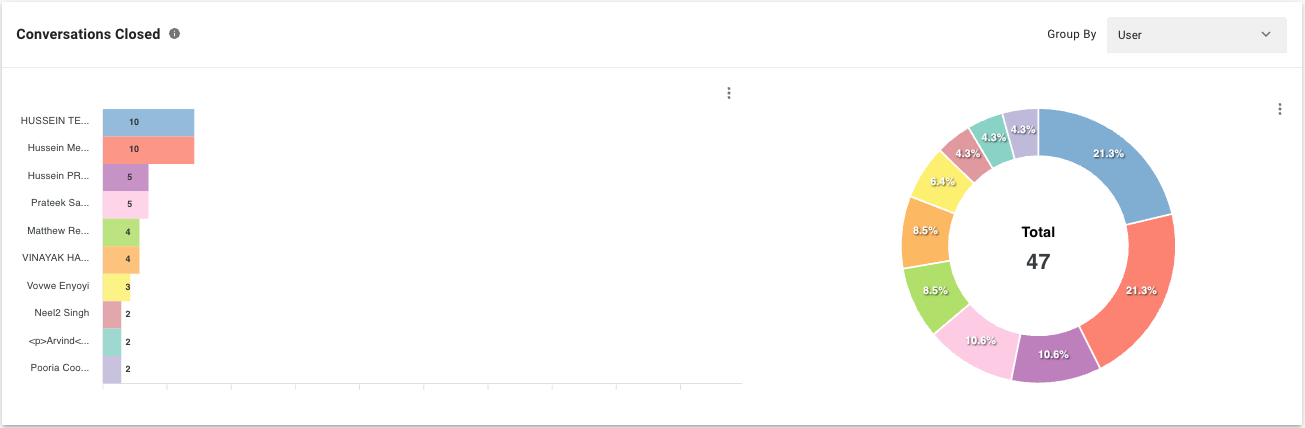
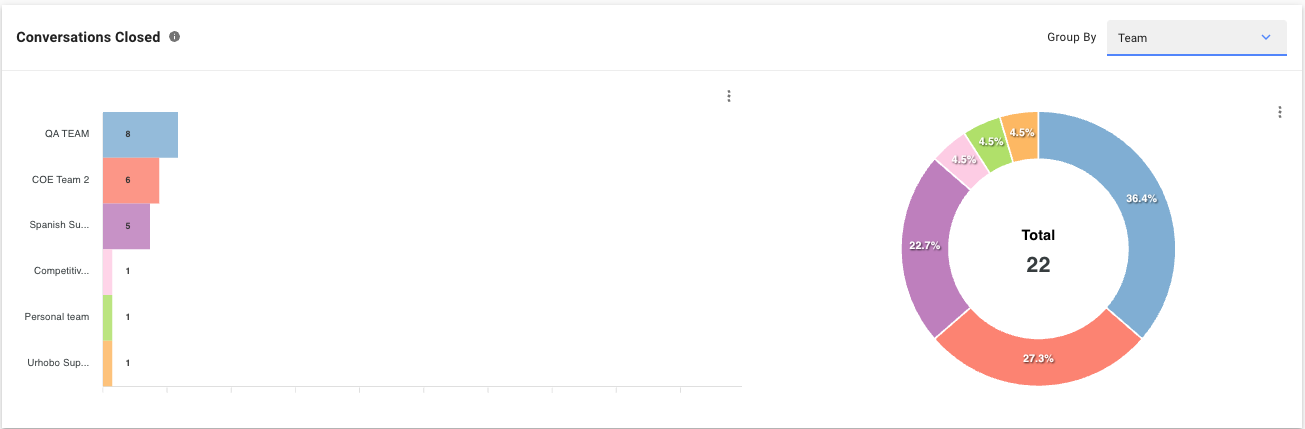
Metric
The number and percentage of conversations closed by users or teams within the selected period. The number of conversations is added every time a conversation is closed by a user or team.
Bar Chart
Compares the users' or teams' number of conversations closed within the selected period.
Pie Chart
The users' or teams' percentage and total number of conversations closed by users or teams within the selected period.
The next few charts compare users’ or teams’ performance on metrics related to response and resolution time. Use the drop-down menu on the top right of each chart to switch between group by User and group by Team views.
Average First Response Time
Metrics
The average amount of time taken by users or teams to send the first response to Contacts from the time when the conversations were opened, within the selected period. This metric is attributed to the user who provided the first response.
Average First Assignment to First Response Time
Metrics
The average amount of time taken by users or teams to send the first response to the Contact from the time when the conversation was first assigned, excluding the time to assignment. This metric is attributed to the user who provided the first response.
Average Response Time
Metrics
The average amount of time taken by users or teams to respond to Contacts within the selected period. This metric includes all responses given by the user in all conversations, regardless of the assignee of the conversations.
Average Resolution Time
Metrics
The average amount of time taken by users or teams to close conversations from the time when the conversation was opened, within the selected period. This metric is attributed to the user who closed the conversation.
Average First Assignment to Close Time
Metrics
The average amount of time taken by users or teams to close conversations from the time when the conversation was first assigned, excluding the time to assignment. This metric is attributed to the user who closed the conversation.
Average Last Assignment to Close Time
Metrics
The average amount of time taken by users or teams to close conversations from the time when the conversation was last assigned to the user, within the selected period. This metric is attributed to the user who closed the conversation.
Feeling stuck? Do not fear.
Need assistance? Contact us for support. Help is here!This is the text block that will appear when the button is clicked.
Reports: Assignments
Reports: Users
Related Articles
Reports: Broadcasts
View the delivery rates of broadcasts to gain insights into the performance and delivery data of the broadcasts.
Reports: Assignments
View the Contact assignment activity on the platform.
Reports: Responses
View the response rate of conversations so you know if your Contacts’ inquiries are being attended to in a timely manner.