Table of Contents
Reports: Broadcasts
The Broadcasts report provides insights into the results of each broadcast. You can refine the data to analyze the performance in terms of broadcast messages delivery and the number of recipients of a single broadcast or a campaign of multiple broadcasts.
Getting Here
Navigate to the Reports module and click Broadcasts.
Filters
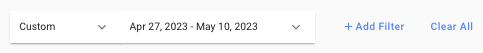
- Frequency and date — Select a date range from the drop-down list to be applied to the report. Alternatively, you can define the date range by frequency. The following options are available:
- Today
- Yesterday
- Last 7 Days
- Last 14 Days
- Last 30 Days
- This Month
- Last Month
- +Add Filter — You can refine the view of the report components by adding more filter(s). The following filters are available:
- Channel - Channels that have been deleted from the Workspace are not available for selection. However, the report will include data from these deleted channels.
- Label
- Broadcast Name - This is useful to filter out a specific broadcast to analyze its performance.
- Sent By
- Segment
- Clear All — You can use this option to reset the filters to the default selections.
- The selected filter(s) are not applicable here: This means the filter(s) you have selected are not applicable to the chart.
- The selected filter(s) have no applicable data: This means no data is available for the selected filter(s), for e.g. the chart is new and only available at a date later than the selected date range.
Report Components
Broadcasts Overview
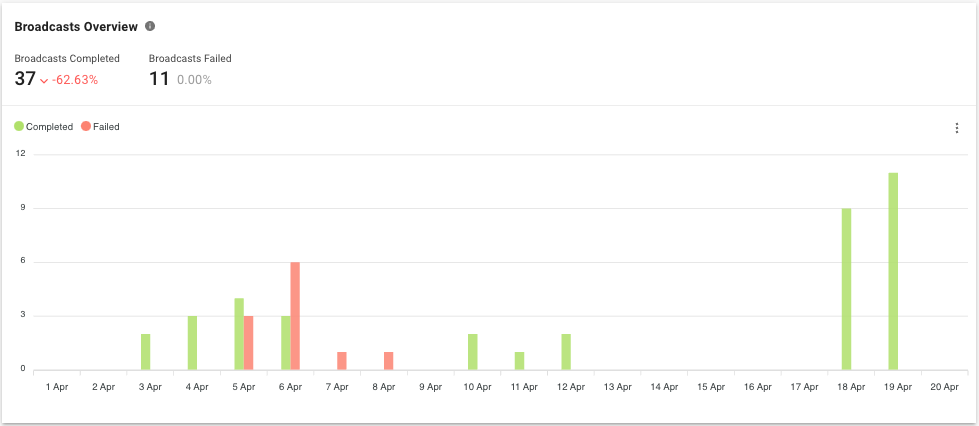
This overview shows the number of broadcasts completed and failed within the selected period based on the delivery time. It helps you to understand the overall performance of the broadcasts.
Metric #1: Broadcasts Completed
The number of completed broadcasts within the selected period.
Metric #2: Broadcast Failed
The number of broadcasts that failed to deliver within the selected period.
Bar Chart: Broadcasts Completed vs Failed
The number of broadcasts that are completed and failed to deliver within the selected period.
Broadcasts Completed
This overview shows the number and percentage of broadcasts completed within the selected period based on the delivery time. The chart can be grouped by Channel or Sent By to understand the performance of broadcasts that are sent on different channels or by users who sent the broadcasts.
Broadcasts Completed by Channel
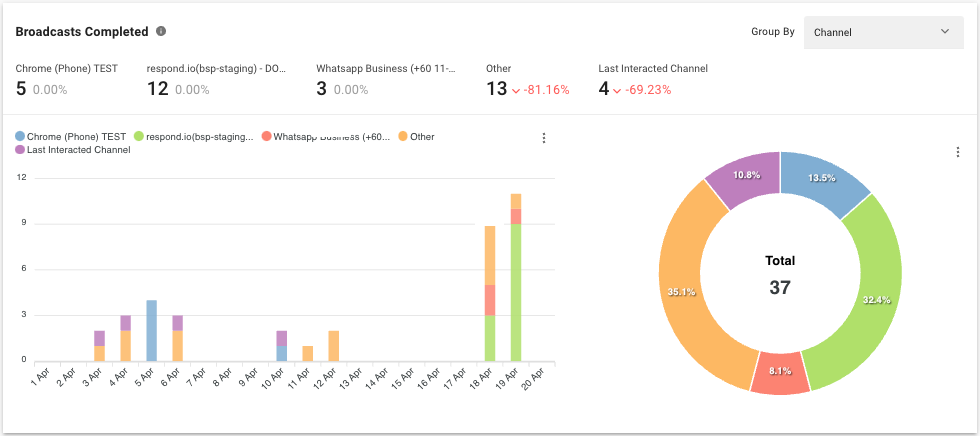
Metric
The number and percentage of broadcasts completed within the selected period by channel.
Bar Chart
The number of broadcasts completed within the selected period by channel.
Pie Chart
The percentage and total number of broadcasts completed within the selected period by channel.
Broadcasts Completed by Sent By
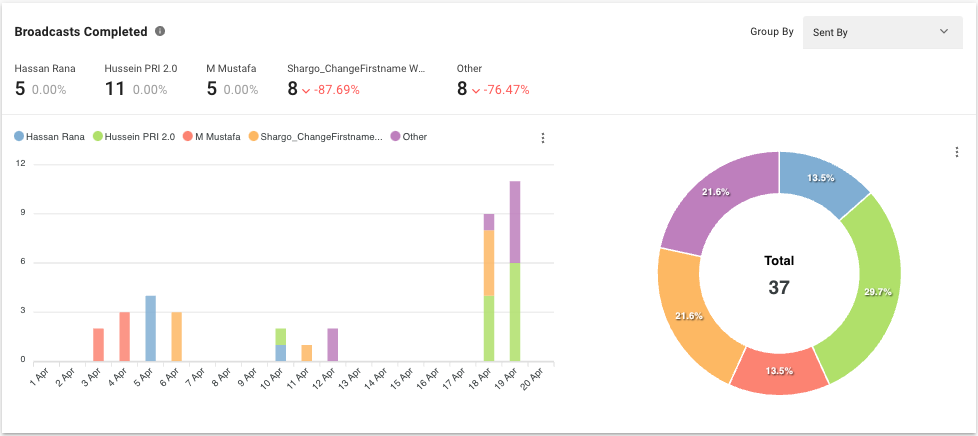
Metric
The number and percentage of broadcasts completed within the selected period by users who sent the broadcasts.
Bar Chart
The number of broadcasts completed within the selected period by users who sent the broadcasts.
Pie Chart
The percentage and total number of broadcasts completed within the selected period by users who sent the broadcasts.
Broadcast Messages
This overview shows the number and percentage of broadcast messages for the broadcasts that were sent within the selected period based on the delivery time. The chart can be grouped by Channel or Sent By to analyze the broadcast messages performance by different channels and by users who sent the broadcast.
Broadcast Messages by Channel
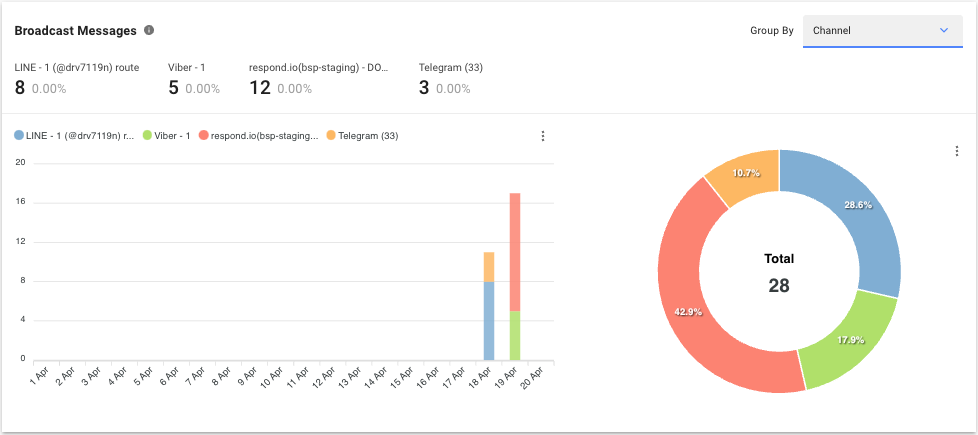
Metric
The number and percentage of broadcast messages for the broadcasts that were sent within the selected period by channel.
Bar Chart
The number of broadcast messages for the broadcasts that were sent within the selected period by channel.
Pie Chart
The percentage and total number of broadcast messages for the broadcasts that were sent within the selected period by channel.
Broadcast Messages by Sent By
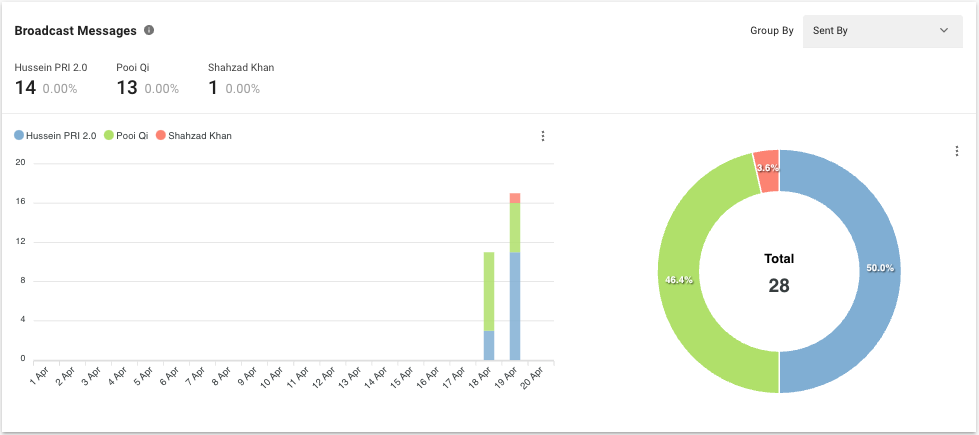
Metric
The number and percentage of broadcast messages for the broadcasts that were sent within the selected period by users who sent the broadcasts.
Bar Chart
The number of broadcast messages for the broadcasts that were sent within the selected period by users who sent the broadcasts.
Pie Chart
The percentage and total number of broadcast messages for the broadcasts that were sent within the selected period by users who sent the broadcasts.
Recipients
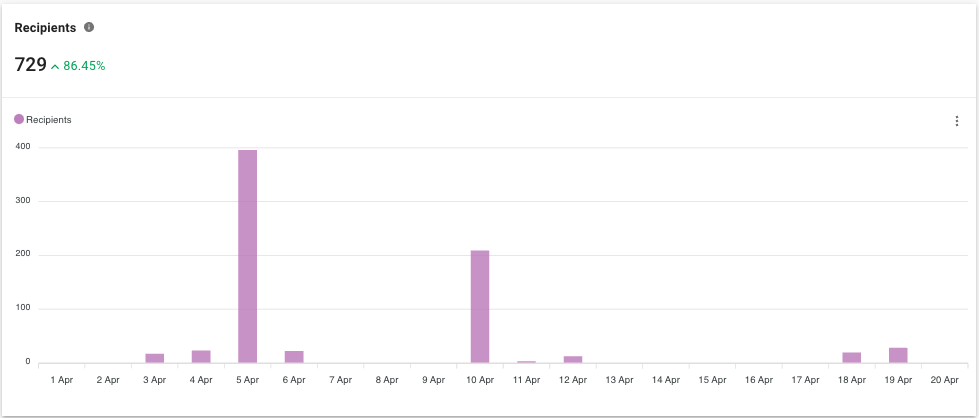
Metric and Chart
The number of recipients who received the broadcast messages from all the broadcasts that were sent within the selected period based on the delivery time.
Broadcast Messages Delivery (Linear)
- If Contacts have turned off Read Receipts on the WhatsApp app's privacy setting, messages they have read will not be reflected in the Read metric. Instead, they will be reflected in the Sent and Delivered metrics. This may cause a discrepancy between the number of Read and Delivered messages.
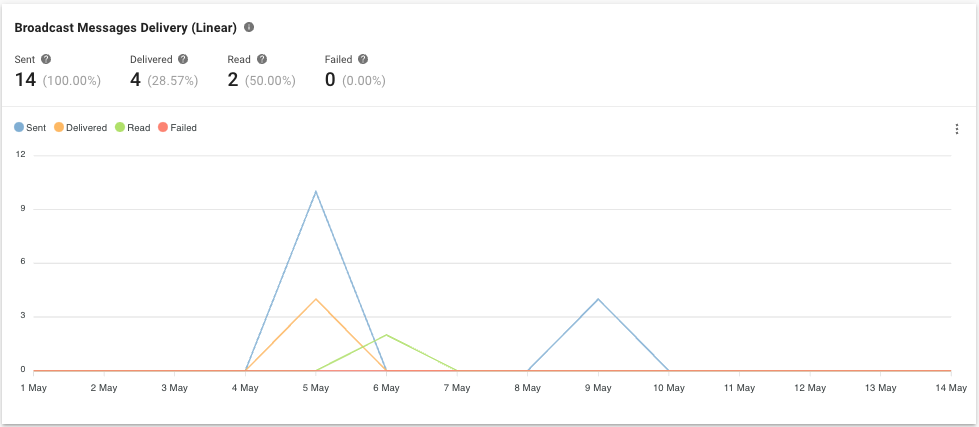
Metric and Chart
The number of broadcast messages for the broadcasts that were sent, delivered, read and failed within the selected period.
Broadcast Messages Delivery (Cumulative)
- If Contacts have turned off Read Receipts on the WhatsApp app's privacy setting, messages they have read will not be reflected in the Read metric. Instead, they will be reflected in the Sent and Delivered metrics. This may cause a discrepancy between the number of Read and Delivered messages.
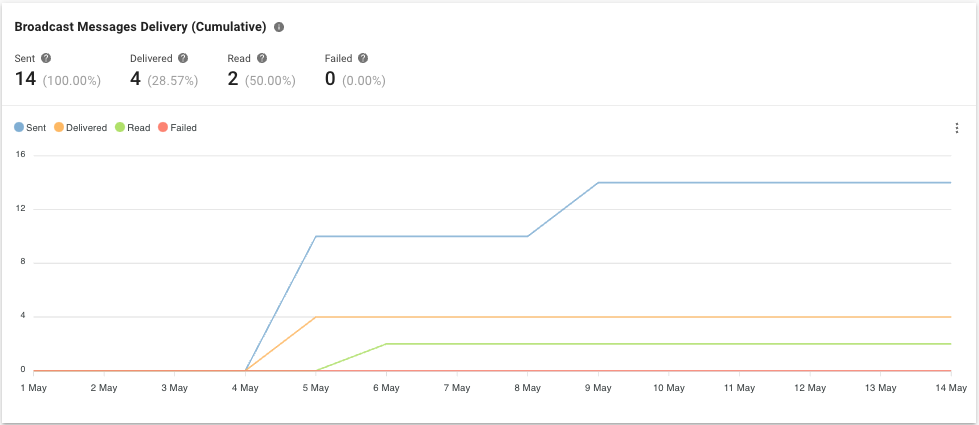
Metric and Chart
The cumulative count of the number of broadcast messages for the broadcasts that were sent, delivered, read and failed within the selected period.
Broadcasts List
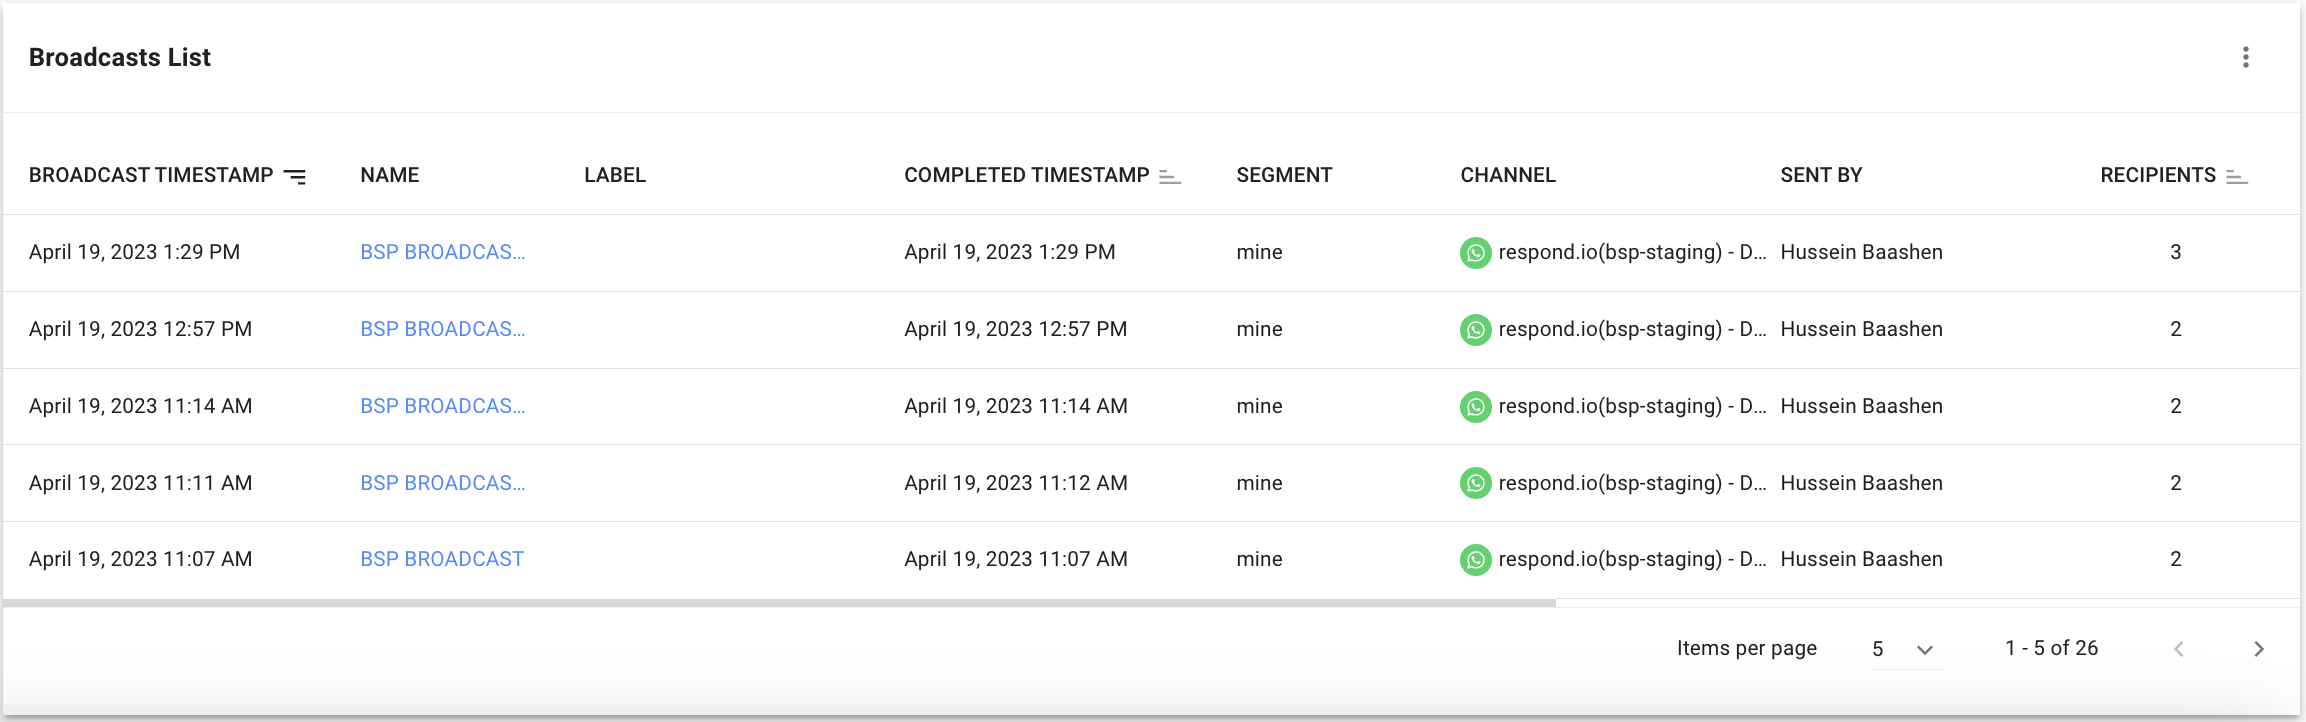
Here are the insights you can gain from each broadcast that happened.
Learn more about each column in the following table:
Table Headers | Description |
Broadcast Timestamp | The date and time the broadcast was scheduled to be sent. |
Name | The name of the broadcast. The name contains a hyperlink to the Broadcast module with the Broadcast Details Drawer of the selected broadcast opened. |
Label | Label added to the broadcast. |
Completed Timestamp | The date and time the broadcast was completed. |
Segment | The segment to which the broadcast was sent. |
Channel | The channel from which the broadcast was sent. |
Sent By | The name of the person who sent the broadcast. |
Recipients | The number of recipients for the broadcast. |
Total Messages | The total number of broadcast messages for the broadcast. |
Sent | The total number of broadcast messages with the Sent status. |
Failed | The total number of broadcast messages that failed to deliver. |
Delivered | The total number of broadcast messages with the Delivered status. |
Read | The total number of broadcast messages with the Read status. |
FAQ and Troubleshooting
How does the date range filter affect the data displayed in Broadcast Messages Delivery charts?
The examples here are applicable to both Broadcast Messages Delivery (Linear) and Broadcast Messages Delivery (Cumulative) charts.
If your selected period is the month of April:
- The charts will filter all the broadcasts that were sent in April, and display data only from broadcasts sent in April.
- If a broadcast is sent on 31st March but the broadcast message for this broadcast gets read on 1st April, this will not be reflected in the report because the broadcast was sent on 31st March.
- If a broadcast is sent on 30th April, the broadcast message for this broadcast will be reflected in the report under the Sent count. However, if this broadcast message only gets read on 1st May, this broadcast message will not be reflected in the report under the Read count due to the selected period being the month of April.